7 Volcano Plot
This Page allows you to explore the analytes that are changing between conditions in greater detail, as well as to select analytes of interest for downstream analysis. The box on the left indicates which sample group comparison is visualized in the volcano plot below and the number of differentially regulated analytes of this comparison using the statistical parameter shown in the left box. By clicking on View Table all significantly regulated proteins are shown and can be exported as .csv or .xlsx file. Parameters for the differential analysis such as p/q-value cut-off and log2FC cut-off can be changed by clicking on Change.

7.1 Volcano Plot Tab
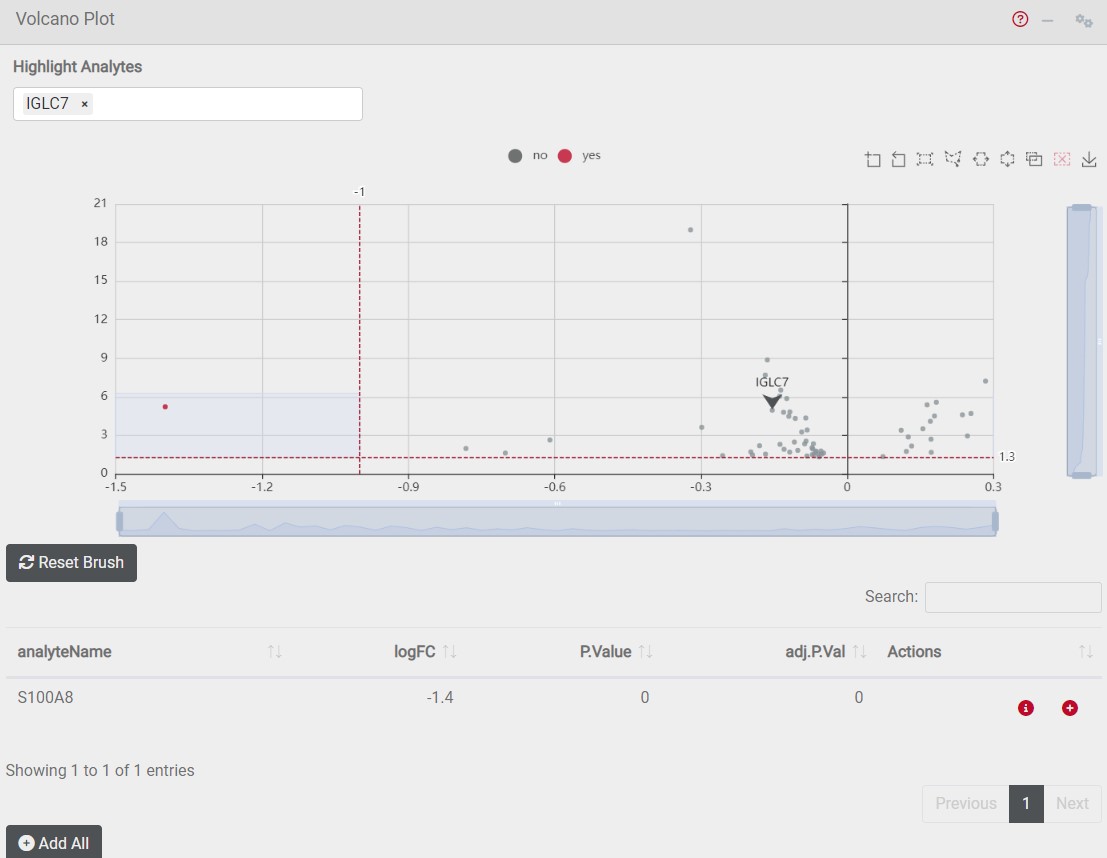
The volcano plot visualizes the regulation of analytes between two sample groups. Significantly downregulated analytes are shown on the left site of the x-axis and are marked in red. Significantly upregulated analytes are shown on the right site of the x-axis and are marked in red. The analytes identified as differentially regulated including their statistical values are shown in the table below. In order to highlight your analyte of interest in the volcano plot type it’s gene name into the search field on top of the volcano plot.