2 Data Summary Tab
The data summary tab provides an overview about the number of proteins and peptides identified in the study including quantitative insights
2.1 Summary of identifications
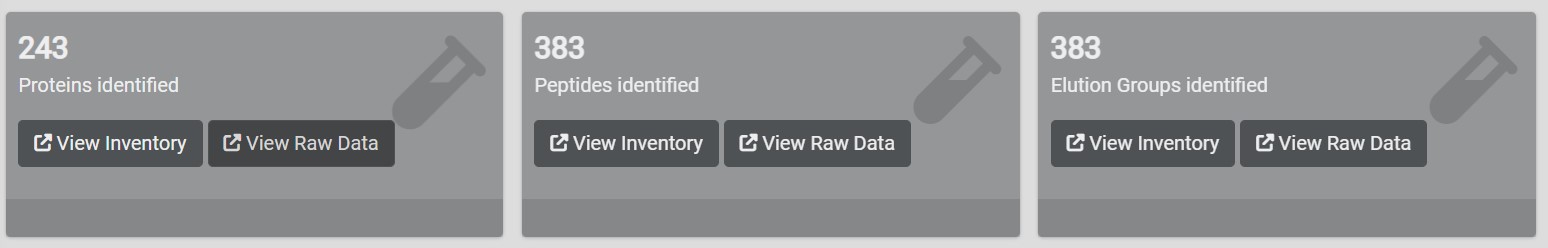
The three boxes at the top of the page summarize the number of identifications in the datasets for Protein Group, Peptide and Elution Group level respectively
2.2 Protein group summary tab
The protein group summary tab provides you with the number of proteins identified per sample. Use the search field to select a specific sample.
2.3 Peptide summary tab
The peptide summary tab provides you with the number of peptides identified per sample. Use the search field to select a specific sample.
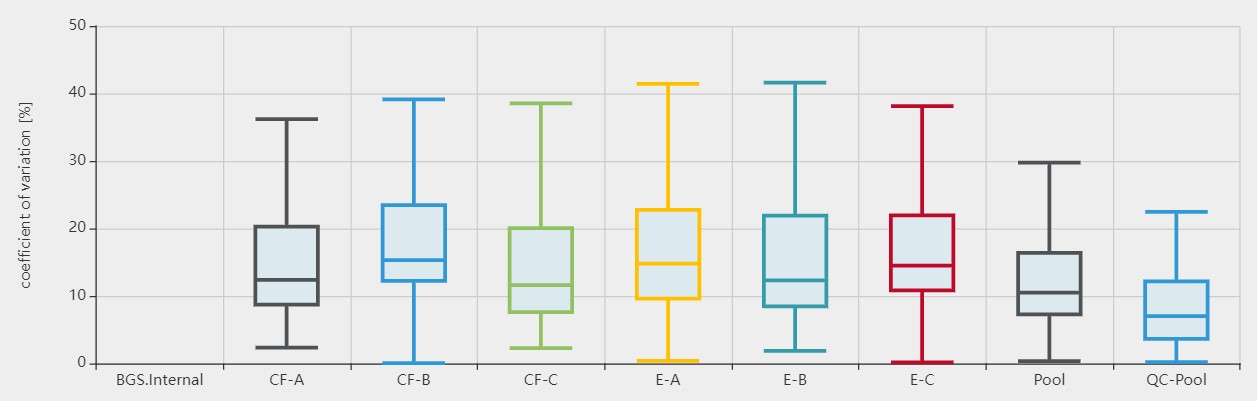
2.4 QC Graphs
The QC graphs provide you with some general quantitative information to asses the quality of the dataset
2.4.1 Protein Group Rank tab
The protein group rank tab shows all proteins identified ranked by their median protein intensity. Proteins of interest can be selected and highlighted by using the search field

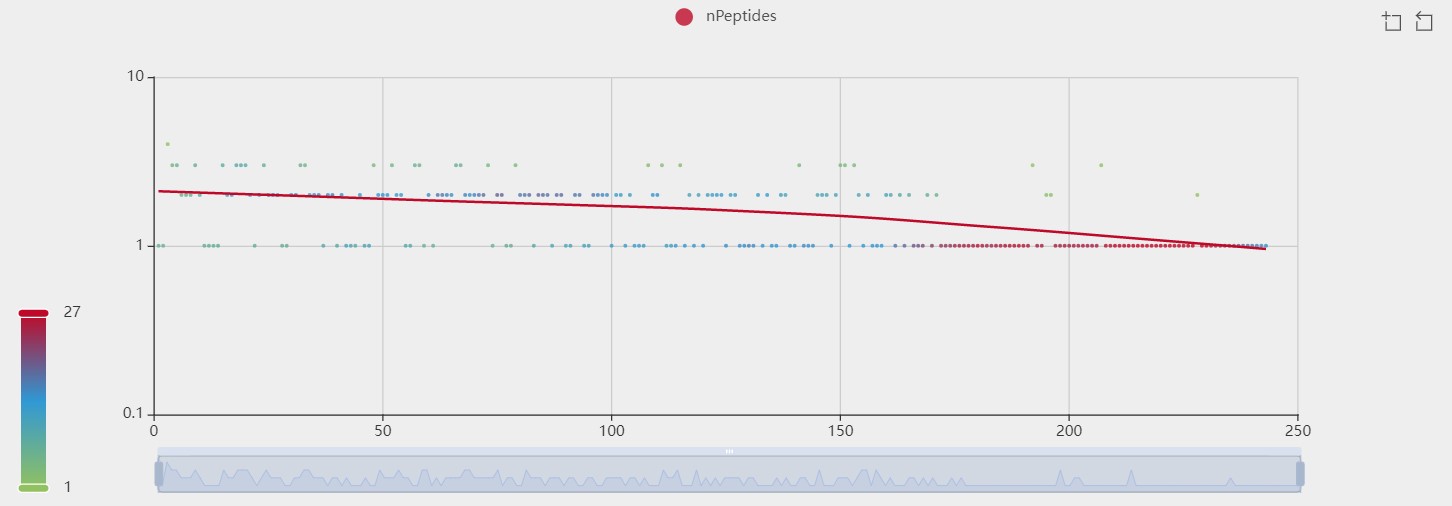
2.4.2 Peptide Protein Correlation tab
The peptide protein correlation tab illustrates the number of peptides identified per protein correlated with the median protein intensity. Highly abundant proteins are usually identified with more peptides than low abundant proteins.