5 PLS-DA Tab
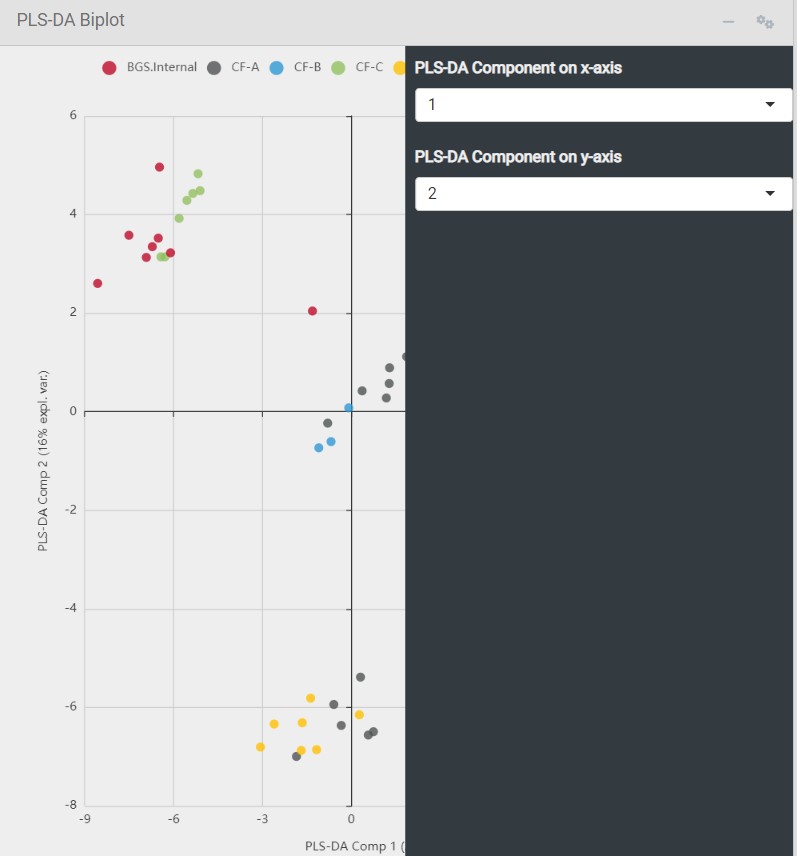
PLS-DA5 is a machine learning method that can be used for discriminant analysis6 or classification. It allows sharpening the difference between condition groups by projecting corresponding data variance onto hyperplanes (components), similar to the principal components of a PCA. By using the icon at the top-right of the box you can select the PLS-DA Components that are shown in the plot below. By browsing with the cursor over the dots the sample ID is shown.
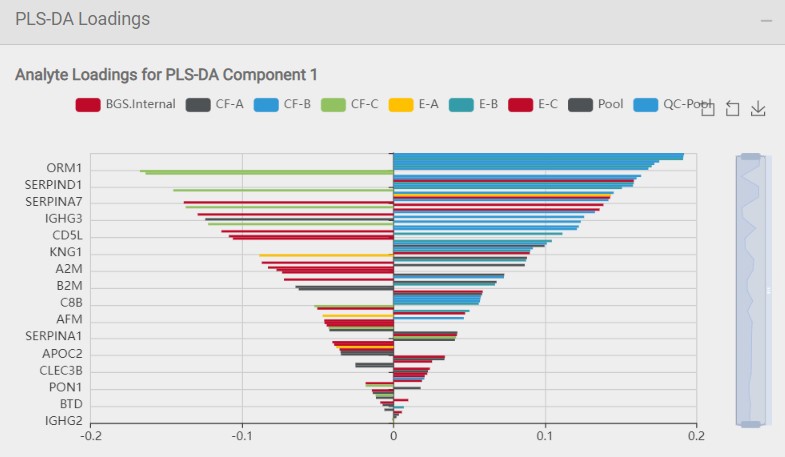
The line plot on the right site shows the analytes with the highest loadings of the selected PLS-DA Components and thereby strongly drive the variation in the dataset. By clicking on the line plot you gain further information about the selected analyte shown in the Analyte Detail Tab as described before.