4 PCA Tab
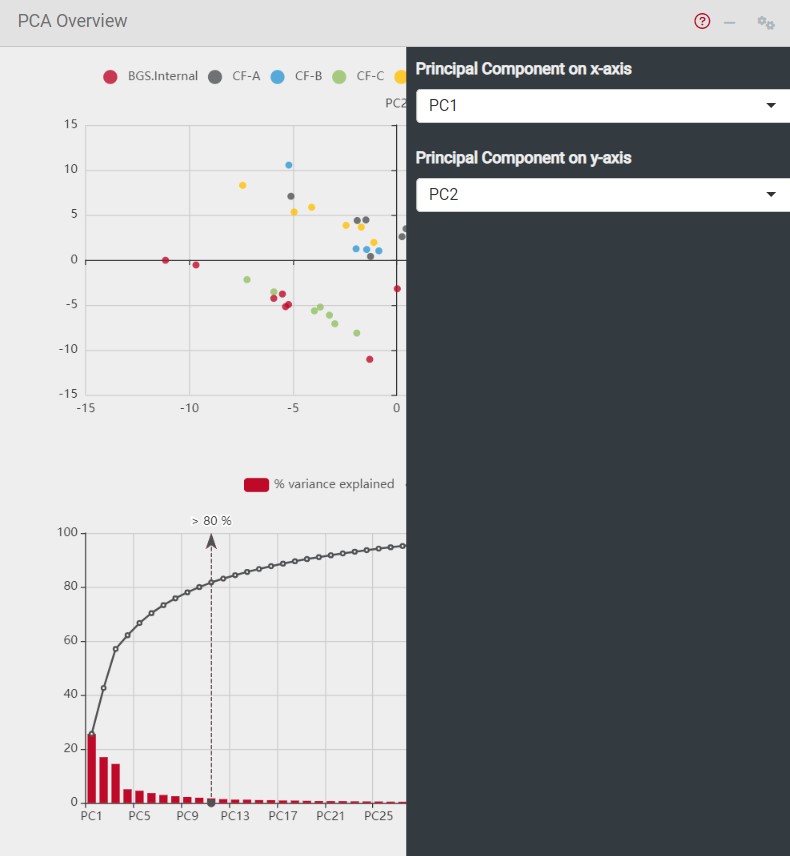
PCA4 is a method of dimensionality reduction and to identify factors that drive the variation in a dataset. By using the icon at the top-right of the box you can select the Principal Components that are shown in the plot below. In the PCA score plot on the left site each sample is positioned according to it’s scores for the selected Principal Components. By browsing with the cursor over the dots the sample ID is shown. The plot below describes the contribution of the different Principal Components to the total variance of the dataset.
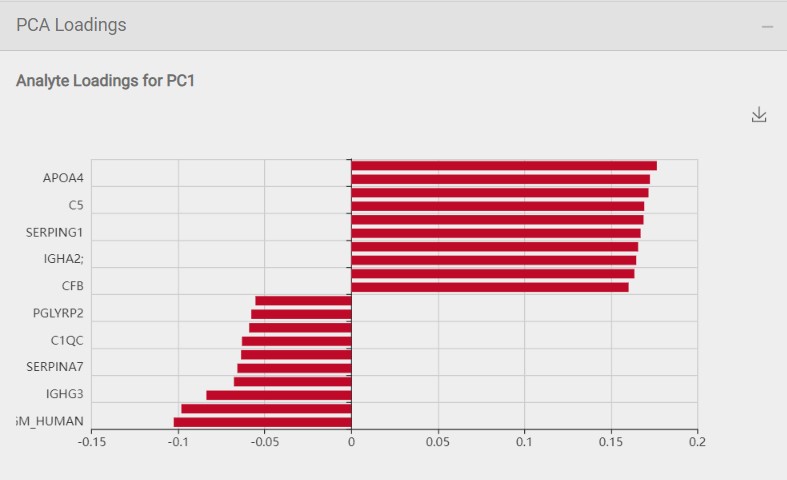
The line plot on the right site shows the analytes with the highest loadings of the selected Principal Components and thereby strongly drive the variation in the dataset. By clicking on the line plot you gain further information about the selected analyte shown in the Analyte Detail Tab as described before.